Diese Seite ist auch verfügbar in: English (Englisch)
Monitoring in Kubernetes und OpenShift wird allgemein als kritisch anerkannt. In der Praxis ist es jedoch oft fragmentiert, inkonsistent und schwer weiterzuentwickeln. Je grösser und älter deine Plattform wird, desto schlimmer wird das Problem.
In meinem Fall arbeitete ich mit einer OpenShift-Landschaft, die über mehrere Jahre gewachsen war:
-
Mehrere Test-, Staging- und Produktions-Cluster
-
Zahlreiche Teams und Services, alte wie neue
-
Ein Flickenteppich von Monitoring-Ansätzen über verschiedene Umgebungen hinweg
Die Konsequenzen waren klar:
-
Manche Services wurden überhaupt nicht überwacht
-
Andere hatten Alarme in einer Umgebung, aber nicht in einer anderen
-
Niemand konnte mit Sicherheit sagen, ob das Monitoring wirklich „vollständig“ war
Diese Situation ist für eine Plattform im grossen Massstab nicht tragbar.
Die Herausforderung gewachsener OpenShift-Landschaften
Wenn du OpenShift schon seit ein paar Jahren betreibst, klingt diese Geschichte vertraut. Du beginnst mit einem einzelnen Entwicklungs-Cluster. Später kommen Produktions-Cluster hinzu. Schliesslich betreibst du ein halbes Dutzend Cluster, jedes mit seinen Eigenheiten.
Monitoring entwickelt sich stückweise:
-
Ein Team setzt hier Prometheus auf, ein anderes fügt dort ein Grafana-Dashboard hinzu
-
Regeln und Alarme werden manuell definiert, oft als YAML-Manifeste
-
Konfigurationen driften auseinander, Abdeckungs-Lücken entstehen, fragile Systeme tauchen auf
Das Ergebnis ist ein Flickenteppich von Monitoring-Regeln, dem niemand vollständig vertraut. Genau hier verändert der Ansatz „Monitoring as Code“ das Spiel.
Die Idee: Monitoring als Bibliothek
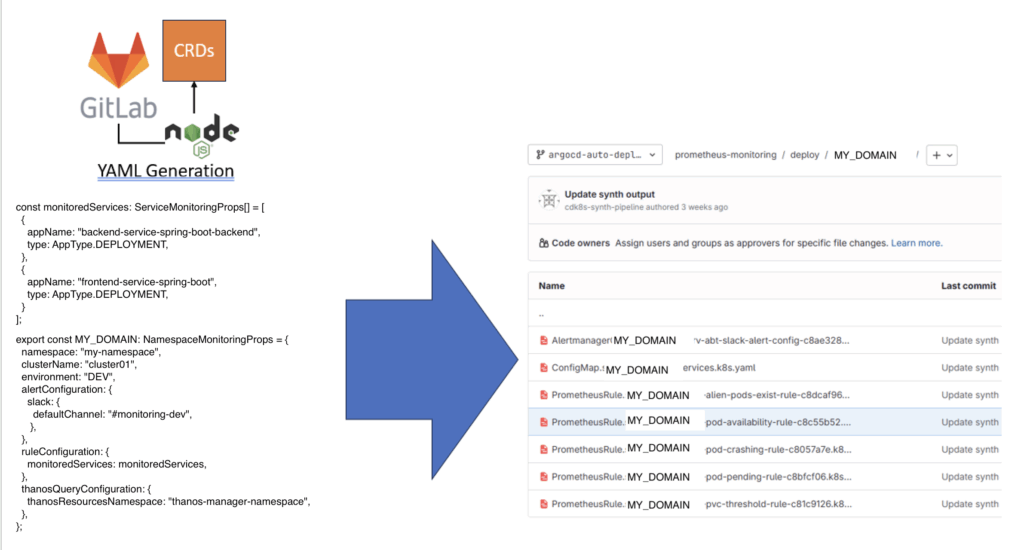
Anstatt Monitoring-Manifeste von Hand zu pflegen, habe ich eine TypeScript-Bibliothek auf Basis von CDK8s (Cloud Development Kit for Kubernetes) gebaut.
Diese Bibliothek integriert sich direkt mit dem Prometheus Operator in OpenShift/Kubernetes und bietet eine High-Level-Abstraktion für Monitoring. Entwickler müssen weder PromQL lernen noch PrometheusRule-Manifeste schreiben. Stattdessen deklarieren sie einfach, welche Services überwacht werden sollen, und die Bibliothek übernimmt den Rest.
So funktioniert es:
-
Ein Consumer-Projekt importiert die Bibliothek und deklariert seine Monitoring-Bedürfnisse.
-
Die CI/CD-Pipeline führt
cdk8s synthaus, wodurch Manifeste wie PrometheusRules, ServiceMonitors und PodMonitors erzeugt werden. -
Die Pipeline committed diese Manifeste zurück ins Git.
-
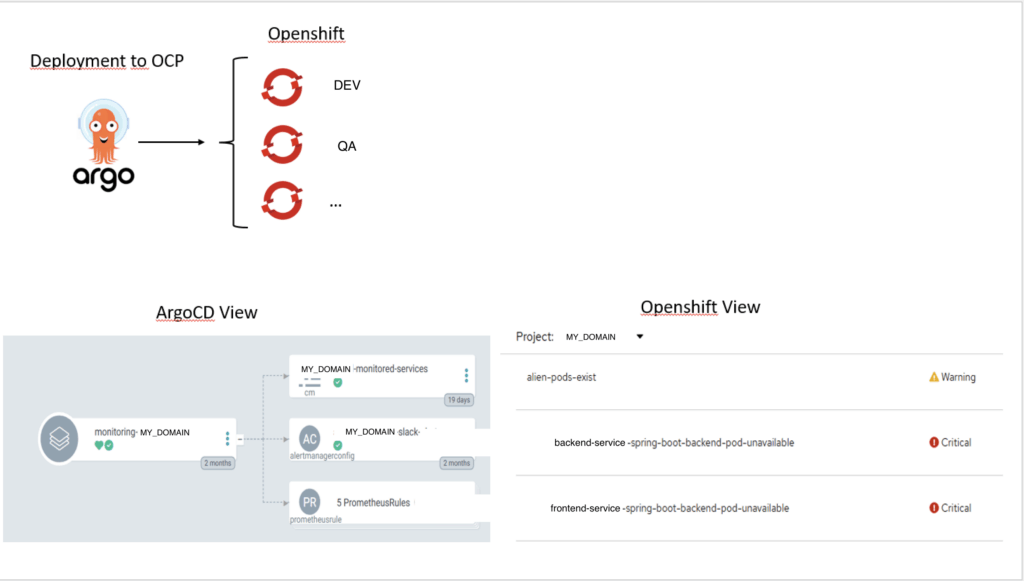
ArgoCD erkennt die Änderungen und spielt sie in den passenden OpenShift-Cluster ein.
Monitoring wird zu reinem Code: versioniert, reviewbar, automatisiert und wiederholbar.
Wie es funktioniert: Vom Commit bis zum Cluster
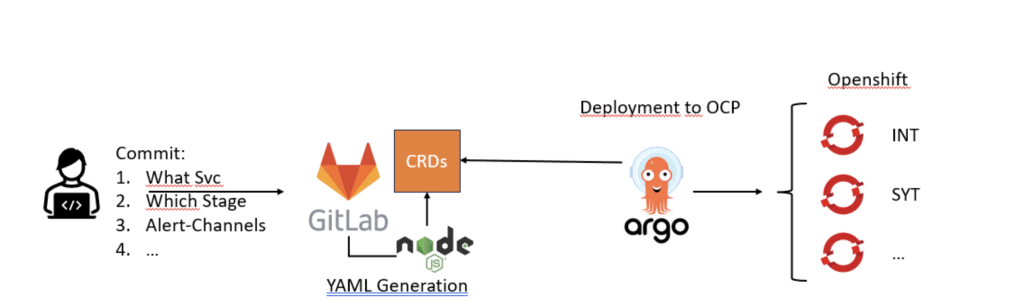
Entwickler-Workflow
Für Entwickler ist das Onboarding ins Monitoring einfach:
-
Commit deiner Absicht
-
Deklariere, welcher Service überwacht werden soll.
-
Gib an, welche Stage: INT, SYT, PROD usw.
-
Konfiguriere Alarm-Kanäle: z. B. Slack-Kanäle deines Teams.
-
Füge alle benötigten Metadaten hinzu: Cluster-Name, Umgebung usw.
-
-
Push zu GitLab
-
Sobald du deine Änderungen pushst, übernimmt die Pipeline.
-
Das war’s! Entwickler committen nur TypeScript-Konfiguration zusammen mit ihrem Service-Code.
Hinter den Kulissen
-
Pipeline-Ausführung – die CI/CD-Pipeline ruft die TypeScript- + CDK8s-Bibliothek auf.
-
YAML-Generierung – Manifeste (PrometheusRules, PodMonitors, Alertmanager-Routes usw.) werden automatisch erstellt.
-
GitOps-Übergabe – die Manifeste werden zurück ins Git committed.
-
ArgoCD-Deployment – ArgoCD spielt die Konfiguration in die passende OpenShift-Stage ein.
-
Aktives Monitoring – Prometheus und Alertmanager beginnen sofort mit Scraping und der Auswertung von Regeln.
Features im Überblick
Standardregeln (für jeden deklarierten Service)
-
Unwanted Pod Existence – entdeckt neue Services, die noch nicht überwacht werden
-
Missing Metrics – markiert Services ohne Metriken
-
Pod Pending – alarmiert, wenn Pods zu lange pending bleiben
-
Pod Crashing – entdeckt Crash-Loops oder häufige Neustarts
-
Pod Availability – stellt sicher, dass Replikas die Verfügbarkeitsziele erfüllen
Zusätzliche Regeln (dynamisch bei Bedarf hinzugefügt)
-
PVC Thresholds – überwacht Persistent-Volume-Auslastung
-
Kafka Rules – überwacht Consumer-Lag und Broker-Gesundheit
-
HTTP Rules – prüft REST-Endpunkte auf Verfügbarkeit und Latenz
-
Custom PromQL – verpackt benutzerdefinierte Abfragen in standardisierte PrometheusRules
Alerting- & Notification-Integrationen
-
Slack-Integration – Standard- und Team-spezifische Kanäle
-
ITIL/Webhook-Integration – leitet Alarme an Ticketing- oder Incident-Systeme weiter
Ökosystem-Integrationen
-
ConfigMaps mit Metadaten
-
Automatisch generiert, z. B. Service-Namen, Umgebungen usw.
-
Dritttools wie Grafana können diese Variablen für Dashboards nutzen.
-
-
RBAC-Ressourcen für zentralisierte Metriken
-
Erstellt RBAC-Policies, sodass Service-Metriken sicher gesammelt werden.
-
Alle Metriken fliessen in einen zentralen Thanos-Pool – globale Abfragen und einheitliche Dashboards werden möglich.
-
Governance & Nachvollziehbarkeit
-
Version-Annotationen → Jede Ressource wird mit der Library-Version annotiert, die sie erzeugt hat – veraltete oder abgeschriebene Regeln sind leicht erkennbar.
GitOps-fähiger Workflow
-
Automatisierte YAML-Generierung über CDK8s.
-
GitOps-Pipeline-Integration: Manifeste werden ins Git committed.
-
ArgoCD-Deployment stellt sicher, dass Monitoring-Ressourcen immer synchron und selbstheilend sind.
End2End-Bild
Das folgende Bild beschreibt den End-to-End-Ablauf – von Code des Consumers bis zur deployten Alarm-Regel.
Warum das wichtig ist
Monitoring sollte kein fragiler Flickenteppich aus YAML-Dateien sein. Es sollte:
-
Deklarativ – als Absicht definiert, nicht manuell konfiguriert
-
Automatisiert – durch Pipelines generiert und deployed
-
Konsistent – einheitlich über Umgebungen hinweg angewendet
-
Testbar – validierbar wie Applikationscode
-
Nachvollziehbar – versioniert und annotiert für Governance
Durch die Kombination von TypeScript, CDK8s und ArgoCD haben wir ein Monitoring-System geschaffen, das sich natürlich mit unserer OpenShift-Landschaft skaliert, anstatt sie auszubremsen.
-
Einmal in der Bibliothek definiert
-
Überall konsistent angewendet
-
Neue Services mühelos eingebunden
Monitoring ist nicht länger optional oder ein nachträglicher Gedanke. Es ist eingebaut, standardisiert, selbstheilend – ein First-Class Citizen der Plattform.