This site is also available in: Deutsch (German)
Monitoring in Kubernetes and OpenShift is generally recognized as critical. In practice, however, it is often fragmented, inconsistent and difficult to develop further. The bigger and older your platform gets, the worse the problem becomes.
In my case, I was working with an OpenShift landscape that had grown over several years:
-
Multiple test, staging and production clusters
-
Numerous teams and services, old and new
-
A patchwork of monitoring approaches across different environments
The consequences were clear:
-
Some services were not monitored at all
-
Others had alarms in one environment but not in another
-
No one could say for sure whether the monitoring was really “complete”
This situation is not sustainable for a platform on a large scale.
The challenge of grown OpenShift landscapes
If you’ve been running OpenShift for a few years, this story will sound familiar. You start with a single development cluster. Later, you add production clusters. Eventually, you’re running half a dozen clusters, each with its own peculiarities.
Monitoring develops piece by piece:
-
One team sets up Prometheus here, another adds a Grafana dashboard there
-
Rules and alarms are defined manually, often as YAML manifests
-
Configurations drift apart, gaps in coverage arise, fragile systems emerge
The result is a patchwork of monitoring rules that nobody trusts completely. This is exactly where the “monitoring as code” approach changes the game.
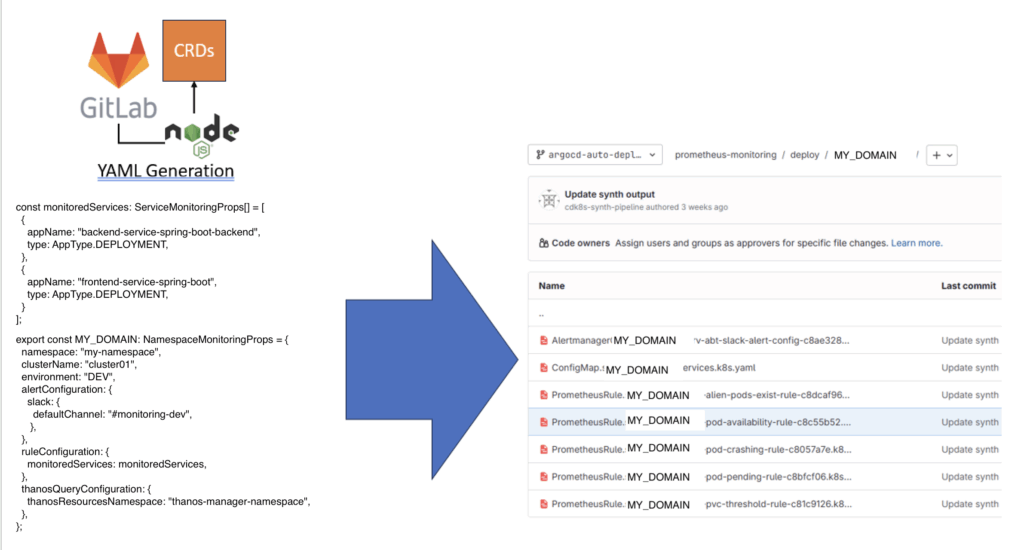
The idea: monitoring as a library
Instead of maintaining monitoring manifests by hand, I built a TypeScript library based on CDK8s (Cloud Development Kit for Kubernetes).
This library integrates directly with the Prometheus Operator in OpenShift/Kubernetes and provides a high-level abstraction for monitoring. Developers do not need to learn PromQL or write PrometheusRule manifests. Instead, they simply declare which services should be monitored and the library takes care of the rest.
This is how it works:
-
A consumer project imports the library and declares its monitoring requirements.
-
The CI/CD pipeline executes
cdk8s synth, which generates manifests such as PrometheusRules, ServiceMonitors and PodMonitors. -
The pipeline commits these manifests back to Git.
-
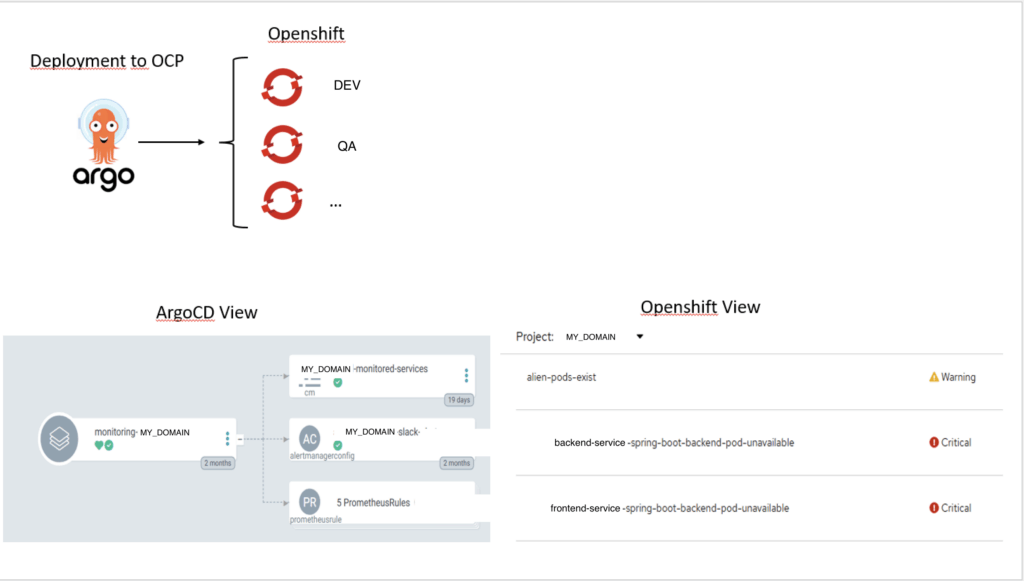
ArgoCD recognizes the changes and imports them into the appropriate OpenShift cluster.
Monitoring becomes pure code: versioned, reviewable, automated and repeatable.
How it works: From commit to cluster
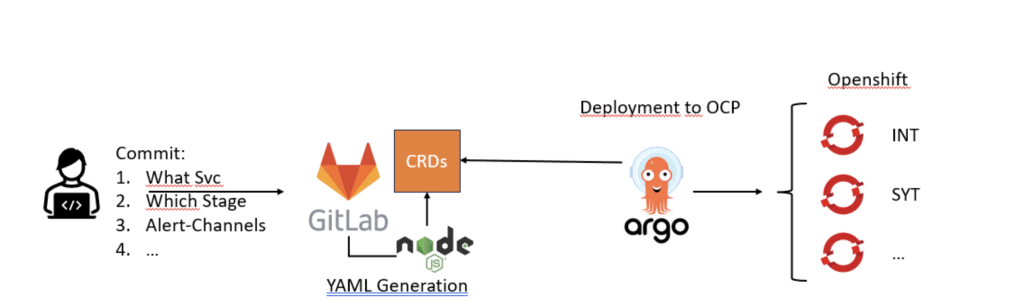
Developer workflow
Onboarding into monitoring is easy for developers:
-
Commit your intention
-
Declare which service is to be monitored.
-
Specify which stage: INT, SYT, PROD etc.
-
Configure alert channels: e.g. your team’s Slack channels.
-
Add all required metadata: cluster name, environment, etc.
-
-
Push to GitLab
-
As soon as you push your changes, the pipeline takes over.
-
That’s it! Developers only commit TypeScript configuration along with their service code.
Behind the scenes
-
Pipeline execution – the CI/CD pipeline calls the TypeScript + CDK8s library.
-
YAML generation – manifests (PrometheusRules, PodMonitors, Alertmanager-Routes etc.) are created automatically.
-
GitOps handover – the manifests are committed back to Git.
-
ArgoCD Deployment – ArgoCD imports the configuration into the appropriate OpenShift stage.
-
Active monitoring – Prometheus and Alertmanager immediately start scraping and evaluating rules.
Features at a glance
Standard rules (for each declared service)
-
Unwanted Pod Existence – discovers new services that are not yet monitored
-
Missing Metrics – marked services without metrics
-
Pod Pending – alerts if pods remain pending for too long
-
Pod crashing – detects crash loops or frequent restarts
-
Pod Availability – ensures that replicas meet the availability targets
Additional rules (added dynamically if required)
-
PVC Thresholds – monitors persistent volume utilization
-
Kafka Rules – monitors consumer lag and broker health
-
HTTP Rules – checks REST endpoints for availability and latency
-
Custom PromQL – wraps user-defined queries in standardized PrometheusRules
Alerting & notification integrations
-
Slack integration – standard and team-specific channels
-
ITIL/Webhook integration – forwards alarms to ticketing or incident systems
Ecosystem integrations
-
ConfigMaps with metadata
-
Automatically generated, e.g. service names, environments, etc.
-
Third-party tools such as Grafana can use these variables for dashboards.
-
-
RBAC resources for centralized metrics
-
Creates RBAC policies so that service metrics are collected securely.
-
All metrics flow into a central Thanos pool – global queries and standardized dashboards become possible.
-
Governance & traceability
-
Version annotations → Each resource is annotated with the library version that created it – outdated or depreciated rules are easily recognizable.
GitOps-capable workflow
-
Automated YAML generation via CDK8s.
-
GitOps pipeline integration: Manifests are committed to Git.
-
ArgoCD Deployment ensures that monitoring resources are always synchronized and self-healing.
End2End image
The following image describes the end-to-end process – from the consumer’s code to the deployed alarm rule.
Why this is important
Monitoring should not be a fragile patchwork of YAML files. It should be:
-
Declarative – defined as an intention, not manually configured
-
Automated – generated and deployed by pipelines
-
Consistent – applied uniformly across environments
-
Testable – validatable like application code
-
Traceable – versioned and annotated for governance
By combining TypeScript, CDK8s and ArgoCD, we have created a monitoring system that scales naturally with our OpenShift landscape instead of slowing it down.
-
Defined once in the library
-
Consistently applied everywhere
-
New services integrated effortlessly
Monitoring is no longer optional or an afterthought. It is built-in, standardized, self-healing – a first-class citizen of the platform.